PRESENTING DATA IN PIE CHARTS
This task has been created for you to upload your presentations.
Activity Instructions: Creating and Presenting Pie Charts
Objective:
In this activity, you will work in groups to create and present pie charts based on real-world data. You will gather information, arrange it into pie charts, and present your findings to the class in a clear and engaging way.
Steps to Follow:
Form Groups:
Divide into small groups (3-4 students per group).Choose a Topic:
Select one of the real-world situations listed below. Think of yourselves as employees preparing a report for a company that requires you to present this data professionally.Research and Gather Information:
Collect data on the chosen topic. You may use real statistics (from reliable sources) or create hypothetical data that is reasonable and relevant. Point out your sources at the end.Create Pie Charts:
Represent your data in pie chart form. You can draw it by hand or use digital tools like Excel, Google Sheets, or Canva.Prepare a Presentation:
Organize a 3–5-minute presentation to explain your pie chart. Include:- A brief introduction to your topic.
- An explanation of the data and the insights it provides.
- A summary of what your chart shows.
Present in Class:
Each group will present their chart and findings to the class. Be prepared to answer questions from your classmates and teacher.
Real-World Situations for Pie Charts:
- Market Share of Companies – Share of major companies in industries like smartphones or soft drinks.
- Population Distribution by Age – Age distribution of a country’s population.
- Budget Allocation – How a school’s budget is divided among different departments.
- Voting Preferences – Voter preferences from a recent election.
- Food Consumption – Average food consumption by category (fruits, vegetables, proteins, etc.).
- Energy Sources – A country’s energy production breakdown (fossil fuels, renewables, nuclear).
- Social Media Usage – Percentage of users on different platforms (Facebook, Instagram, TikTok, etc.).
- Global Water Usage – Water usage by sector (agriculture, industry, domestic).
- Transportation Preferences – How people commute in a city (car, public transport, walking, cycling).
- Charitable Donations – Donations distributed among various causes (health, education, environment, etc.).
Evaluation Criteria:
- Creativity and clarity in creating pie charts.
- Accuracy and relevance of the data.
- Quality of presentation (clarity, structure, and delivery).
- Engagement and ability to answer questions.
Pie Chart Presentation Speaking Rubric
| Criteria | 4 - Excellent | 3 - Proficient | 2 - Developing | 1 - Needs Improvement |
|---|---|---|---|---|
| Accuracy of Data Interpretation | Demonstrates complete and precise understanding of pie chart data; explains all segments with 100% accuracy | Explains most pie chart segments correctly with minor inaccuracies | Demonstrates partial understanding with several data misinterpretations | Significant errors in data interpretation; minimal comprehension of chart |
| Grammar and Language Structure | Uses complex grammatical structures with near-native fluency; zero to minimal grammatical errors | Employs mostly accurate grammatical structures with few minor errors | Demonstrates inconsistent grammatical accuracy; multiple noticeable errors | Frequent grammatical mistakes impede communication |
| Vocabulary Usage | Utilizes sophisticated, domain-specific vocabulary precisely and appropriately | Uses varied and relevant vocabulary with occasional imprecision | Limited vocabulary range; repetitive language | Minimal vocabulary; relies on basic terms |
| Data Presentation Skills | Presents data with exceptional clarity, engaging explanations, and smooth transitions between chart segments | Clearly explains most chart segments with logical flow | Presents data with some confusion and limited explanation | Unclear presentation with minimal coherent discussion of data |
| Fluency and Delivery | Speaks with natural rhythm, confidence, and zero hesitations; maintains excellent audience engagement | Speaks smoothly with occasional brief pauses; generally maintains audience interest | Demonstrates fragmented speech with frequent hesitations | Significant difficulties in maintaining coherent speech flow |
Additional Notes:
- Presentations should be 3-5 minutes in length
- Visual aids (actual pie chart) must be included
- Encourage students to practice beforehand
- Emphasize clear, concise data communication
Sample Answer (Market Share of Companies)
This structured approach should help you and your group confidently prepare, create, and present a comprehensive report using pie charts to analyze real-world data.:
"Good morning, everyone. Today, I will present our analysis of the current smartphone market share. In our report, we focused on the market distribution among three major companies: Apple, Samsung, and Xiaomi, along with a category for other competitors.
As shown in this pie chart, Apple leads the market with a 27% share, followed by Samsung at 23%, and Xiaomi holds almost 14% of the market. The remaining 46% is divided among other smaller companies such as OPPO or VIVO. This distribution indicates that Apple’s strong brand loyalty has helped it secure the largest share, while Samsung benefits from diverse product range, and Xiaomi is gradually expanding its influence in niche segments.
Based on this analysis, we recommend that companies look into strategic partnerships and innovations to capture the untapped segments of the market. Thank you for your attention, and I look forward to discussing any questions you might have."
Now, let's include 'storytelling technique' in the presentation:
Do you see the difference?
Title: Telling the Story of the Smartphone Market
"Good morning, everyone. Imagine walking down the street—what do you see? People engrossed in their smartphones, scrolling through news, texting friends, or streaming videos. Now, have you ever wondered which company dominates this ever-growing market? Today, I will take you on a journey through the world of smartphone market share, exploring the strengths of key players and uncovering insights into their strategies.
Let’s begin with a story. Meet Alex, a university student who recently decided to upgrade his phone. He faced three main choices: an Apple device, a Samsung model, or a Google Pixel. Like Alex, millions of people make this decision every day, shaping the competitive landscape of the smartphone industry.
Now, let’s look at the data. Here’s a visual representation of the current market share. As illustrated in this pie chart, Apple leads with a 27% share, followed closely by Samsung at 23%, while Xiaomi holds almost 14%. The remaining 46% is shared among smaller competitors in which OPPO and VIVO can be found.
What does this tell us? Apple’s strong brand loyalty appeals to various consumer needs, from a tightly integrated ecosystem, and brand prestige. Samsung, on the other hand, thrives on broad product range, and from budget-friendly options to premium devices. Meanwhile, Xiaomi, though holding a smaller share, is steadily making inroads with its focus on software innovation and artificial intelligence features.
So, what’s next for the smartphone market? Our analysis suggests that companies aiming to expand their reach should consider strategic partnerships and invest in cutting-edge innovations, whether in battery life, AI, or seamless user experiences.
And that brings us back to Alex—his final choice? Well, that depends on which company tells the most compelling story through its products. Thank you for your attention. I look forward to discussing any questions you might have."
Data from: https://gs.statcounter.com/vendor-market-share/mobile/worldwide
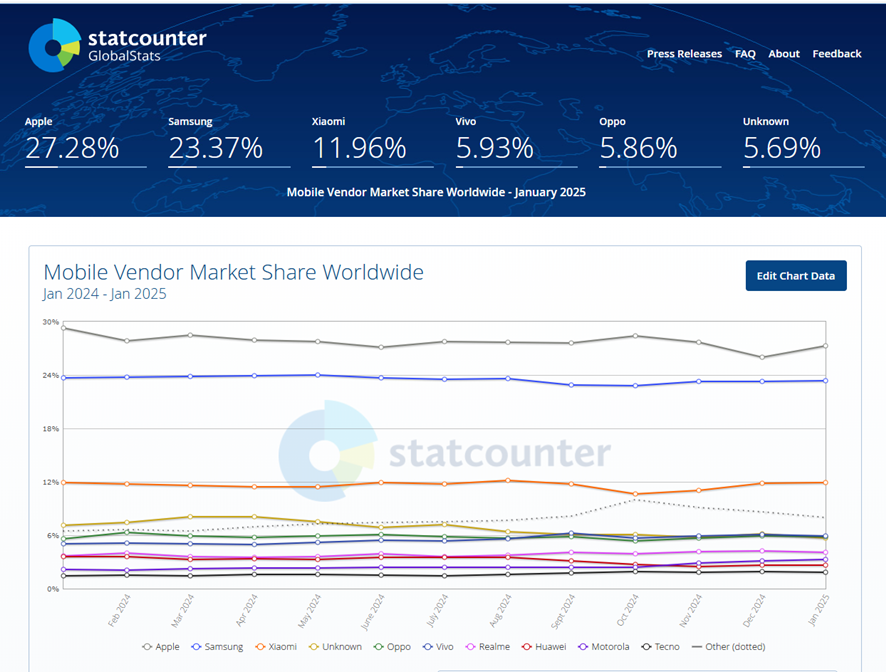
Smartphone Market Share Distribution (as of January 2025):
- Apple: 27.28% oberlo.com+1gs.statcounter.com+1oberlo.com+1
- Samsung: 23.37% gs.statcounter.com
- Xiaomi: 11.96%laureenwreggi.pages.dev+11gs.statcounter.com+11statista.com+11
- Vivo: 5.93% gs.statcounter.com
- Oppo: 5.86%
- Others: 25.60% giacintawemyle.pages.dev